What is a growth boundary breach, and how do ministries measure it in hectares?
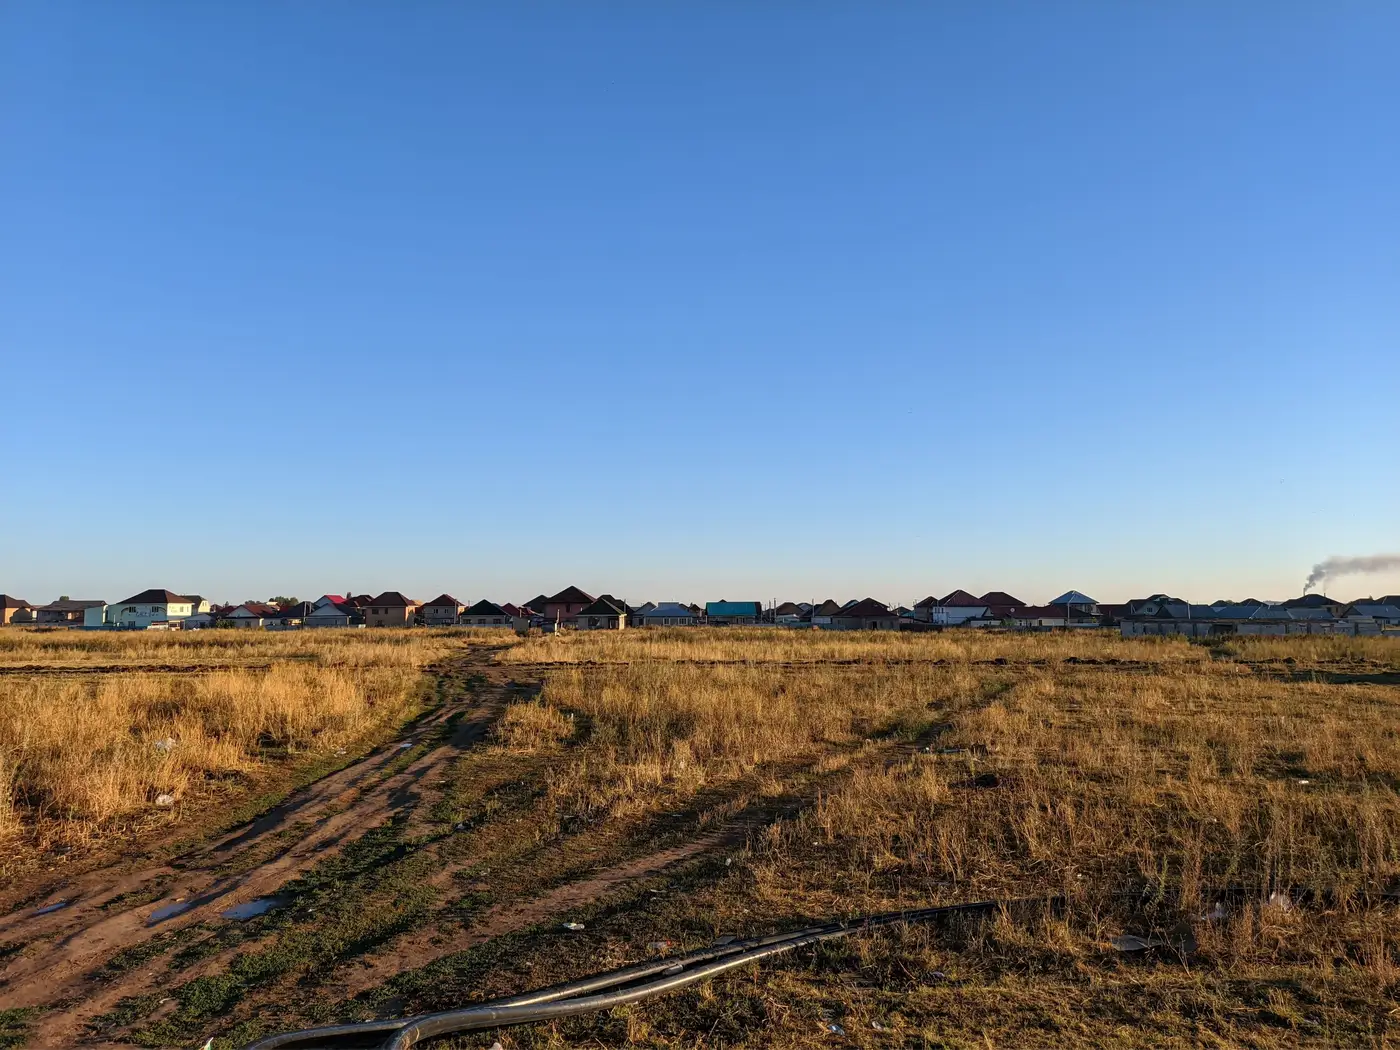
A growth boundary breach, in the plain sense planning offices use it, is new built-up area that shows up outside the line on the approved urban growth boundary map. Not a permit issue, not a zoning dispute on a single parcel. It's a spatial fact: rooftops, pads, or paved surface where the structure plan says there should be farmland, forest, or a buffer.
The boundary itself usually comes from a master plan, a structure plan, or a gazetted UGB polygon, something with a legal date attached to it. Once that line is fixed, anything built past it in a later year is, by definition, out of bounds, regardless of whether a permit was ever filed for it. That's what separates a breach from a code violation. A code violation is about paperwork. A breach is about where the building physically sits.
Turning a line crossing into a hectares figure
Measuring it starts with two things laid on top of each other: the boundary polygon and a built-up footprint layer for the year in question. A GIS analyst clips the built-up layer to the area outside the boundary, then sums the area of whatever built-up pixels or parcels fall in that clipped zone. The output is a single number in hectares, the amount of new construction sitting past the line that year.
Most ministries don't stop at one number. They track it as a compliance metric over time, comparing this year's out-of-boundary built-up area against last year's, against the boundary's original growth allocation, sometimes against a lending covenant that caps how much expansion a city can show before a development bank flags the loan. A development bank reviewing an urban infrastructure loan will often ask for exactly this figure as part of annual reporting, because it's one of the few urban indicators that's hard to argue with. Either the footprint crossed the line or it didn't.
Where this gets slow in practice is the method, not the math. A lot of planning departments still build this number by hand: pulling an old aerial photo, overlaying it against a newer one, tracing new rooftops by eye, cross-checking against the permit ledger to see which parcels got approved and which didn't. It works, but it eats weeks of an analyst's time every reporting cycle, and two analysts tracing the same boundary by hand rarely draw it the same way twice.
Why the metric matters more than the map
A breach map is useful. The number is what gets cited. "Four hundred twelve hectares of unauthorized expansion this year" goes into a compliance report in a way that a shaded polygon on a wall map never will. It's also the figure that lets a ministry compare districts against each other, or compare this administration's growth against the last one's, without anyone needing to squint at two overlapping maps.
That's the gap a yearly built-up change layer is built to close, lining up the current year's footprint against the approved boundary automatically and handing back the hectare figure directly, instead of someone tracing it parcel by parcel. Urban Growth Monitor runs that comparison annually against medium-resolution satellite imagery, so the number updates every year without a new round of manual digitizing.
One thing worth flagging for anyone building this into a report: the hectares figure measures footprint, not severity. A hundred hectares of scattered rural infill reads very differently on the ground than a hundred hectares of dense expansion pressed right up against one stretch of the boundary, even though the number is identical. Most ministries pair the figure with the map itself for exactly that reason. If next year's compliance report needs a number instead of a guess, that's the gap this product fills.