Count the hectares that grew past the growth boundary.

Annual built-up change from medium-resolution satellite imagery, laid over your approved boundary. It takes the place of the aerial photo comparison and the permit ledger match.

GSD
Medium / 3–10 m
Cadence
Annual
Platform
Medium-res satellite
Spectral
Multispectral

The job today

Where the yearly comparison runs out

Every year someone lays an old aerial photograph beside a newer one and marks the new building by eye, district by district. The permit ledger is the second source, and it lists what was approved. It says nothing about what went up without a permit or on a different plot.

The two do not always agree, and the gap between them is what the report has to explain. When the annual planning report falls due, the answer to "did we grow where the plan allowed" rests on a hand-traced sketch and a spreadsheet.
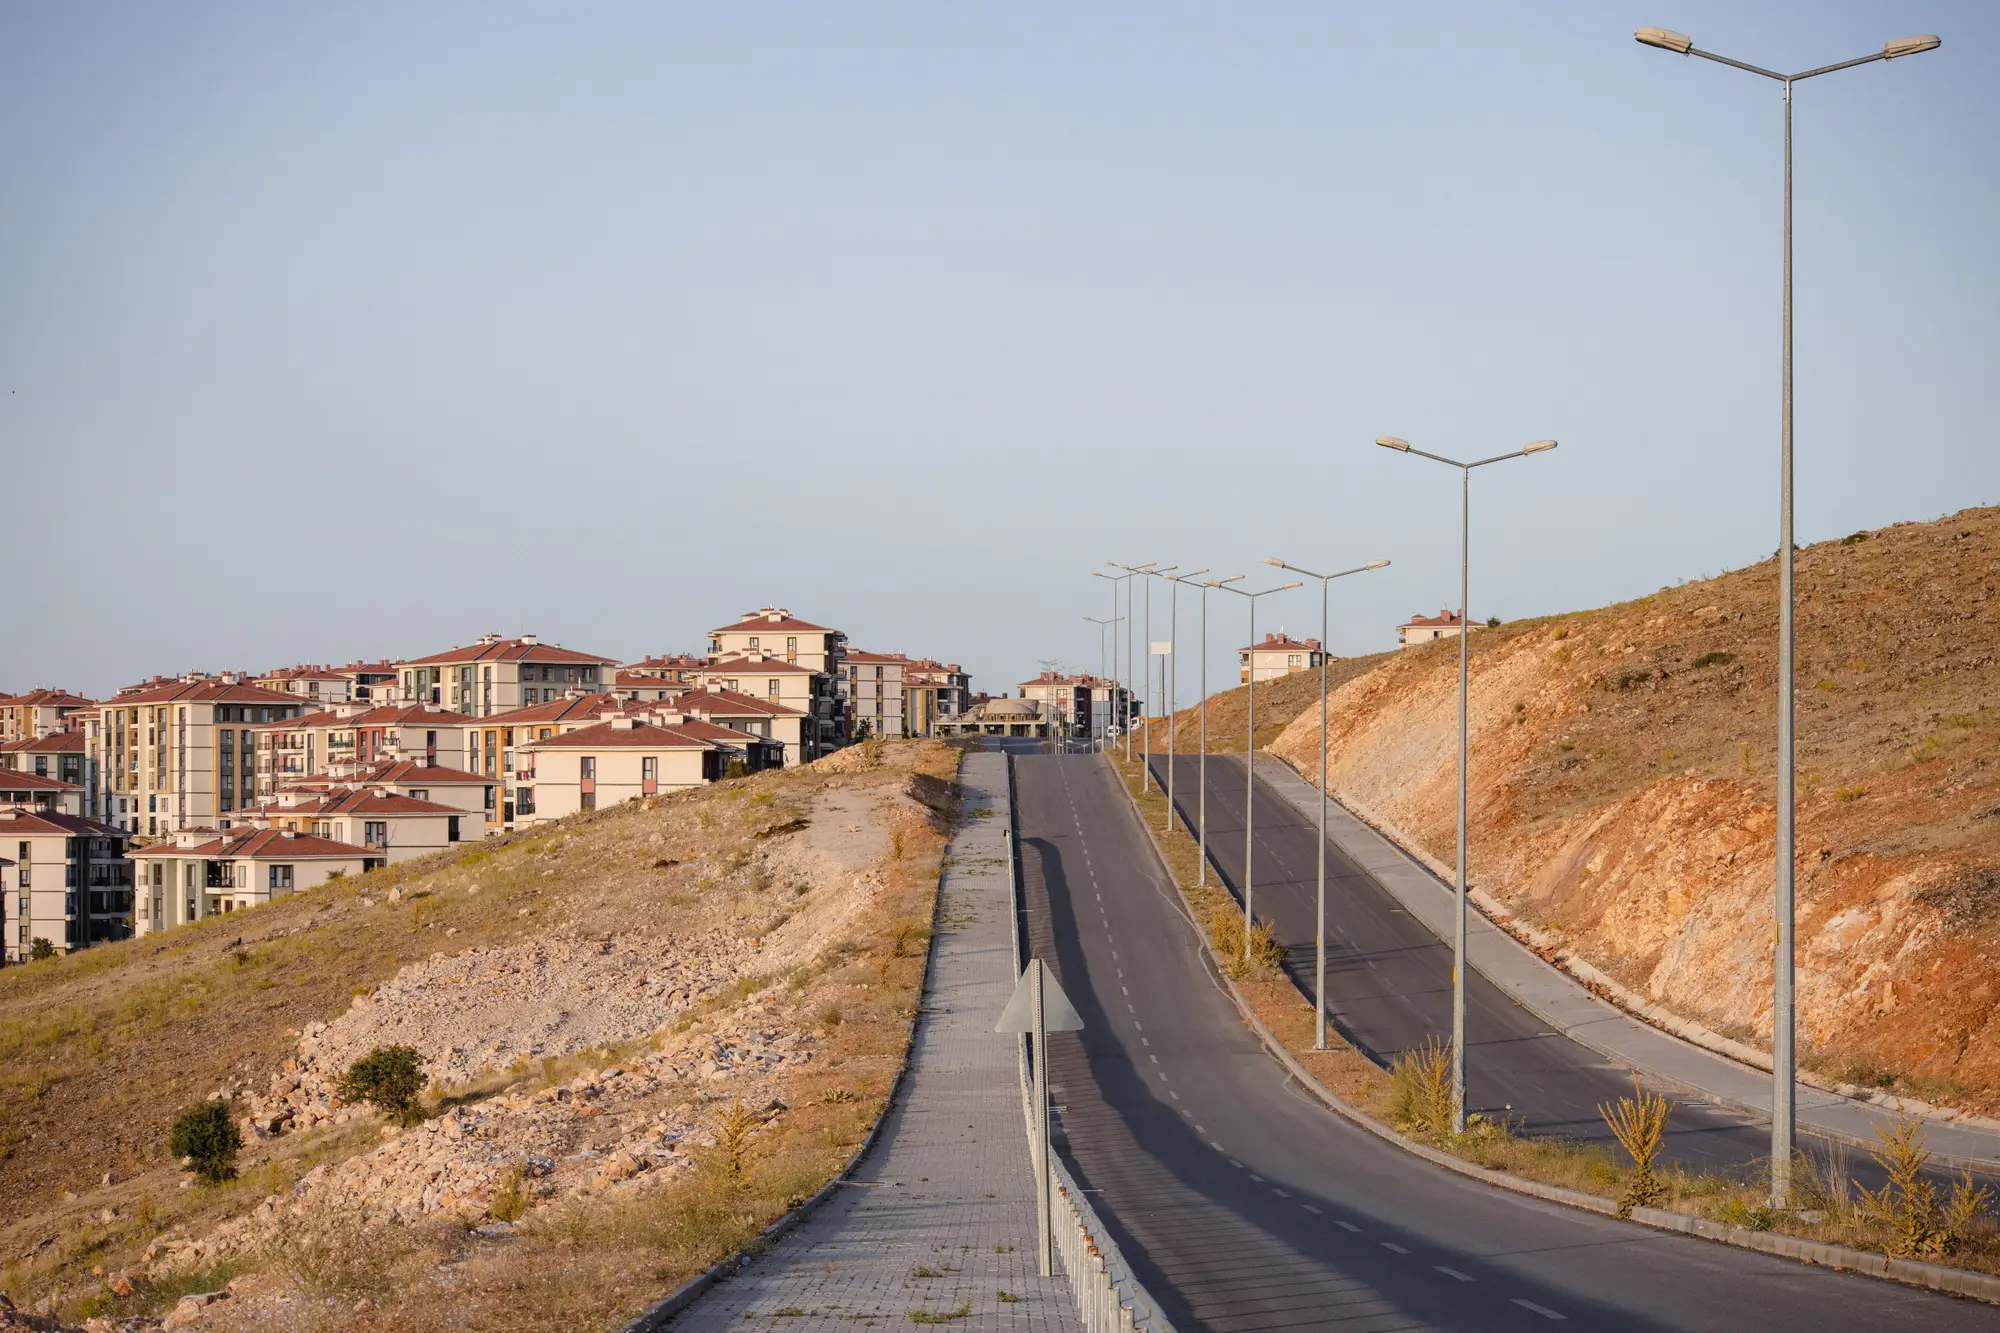
A new road climbing past freshly built apartment blocks on bare hillside at the edge of a city

The yearly comparison, step by step

  1. 01Finding what changed

    Aerial photos and permit ledger

    Someone compares an older aerial photograph with a newer image and marks new building by hand. Where no recent photograph exists for a district, that district waits.

    Urban Growth Monitor

    A change-only layer of the built-up footprint, this year against last, for the whole region in one pass.

    Still yours

    Deciding what the changes mean on the ground.

  2. 02Checking against the boundary

    Aerial photos and permit ledger

    Permit entries are matched to the growth boundary by address or plot reference. Building that never had a permit does not appear in the ledger at all.

    Urban Growth Monitor

    The expansion layer is overlaid on your boundary file, and each patch is tagged as inside or outside the line.

  3. 03Getting the number

    Aerial photos and permit ledger

    Hectares are added up from digitised patches, and the total depends on who traced them and how carefully.

    Urban Growth Monitor

    A hectare summary per zone or district, inside and outside the boundary, worked out the same way every time.

  4. 04Comparing year on year

    Aerial photos and permit ledger

    Each year's comparison starts again with different photo dates and a different tracer, so last year's figure and this year's are hard to set side by side.

    Urban Growth Monitor

    The same imagery type and the same method every year, so the editions line up.

  5. 05Following up on the ground

    Aerial photos and permit ledger

    The field inspection list is built from complaints and gaps in the permit ledger.

    Urban Growth Monitor

    Zones with expansion outside the boundary come back flagged, so the list starts from where growth was measured.

    Still yours

    The inspection itself, parcel checks and any enforcement decision.

What you get

What arrives each year

  1. Built-up change layer

    GeoPackage or shapefile

    Patches that turned built-up between last year's edition and this one, for the whole region. This is the layer that replaces the hand-traced sketch. It opens in QGIS or ArcGIS and arrives once a year.

    Ledger row: Finding what changed
  2. Boundary overlay

    GeoPackage or shapefile

    The change layer cut by your growth boundary, so every patch is marked inside or outside. It serves the boundary step of the ledger and sits next to your own boundary file.

    Ledger row: Checking against the boundary
  3. Hectare summary

    CSV

    A plain readout of hectares of expansion per zone or district, split inside and outside the boundary. It is the figure for the annual planning report.

    Ledger row: Getting the number

How it works

  1. Send the area and the line

    Your city or region boundary and the approved growth boundary, as polygon files.

  2. Imagery

    An annual multispectral composite built from medium-resolution satellite imagery, using the clearest pixels available for the season.

  3. Analysis

    Built-up footprint is classified for this year and compared with last year to find what changed.

  4. Delivery

    The change layer, the boundary overlay and the hectare summary come back for the edition, ahead of your planning report.

Limits

Where the old method still does better, and what medium resolution cannot show.

01Zone scale, not plot scale
At 3–10 m a single house is one pixel or a handful. The layer finds expansion patches and sums them in hectares. It cannot verify an individual parcel or structure.
02Small and informal building
Small extensions, single-room additions and informal building on a small footprint may fall below what resolves. A walk through the district or a very high resolution survey does better there.
03Infill inside built blocks
New building squeezed inside an already built-up block can be invisible at this resolution. The layer is stronger on expansion at the edge than on densification in the middle.
04Permits know things the image doesn't
The ledger holds who applied, what for and what was approved. A satellite layer records only what is on the ground.
05Cloud and the annual edition
The composite uses the best cloud-free pixels available. Persistently cloudy zones may need a longer window, and full coverage of an edition can arrive later than the rest.
06Annual, not continuous
One edition a year. Nothing here watches a site between editions.

Who it's for

Switch if you are

  • A planning analyst at a ministry or development bank who has to report whether expansion followed the master plan.
  • Comparing aerial photos by hand and matching them to a permit ledger each year.
  • Working at the scale of zones, districts and regions.

Stay with the current method if you need

  • Parcel-level or single-structure verification, which takes field inspection or a very high resolution survey.
  • Informal settlement detail at building scale.
  • A legal survey or an evidence file for enforcement. The layer supports planning analysis only.
  • Alerts between annual editions.

FAQ

Questions from planning teams

Does this replace the permit ledger?

No. The ledger records approvals and this records what is on the ground. Put the two side by side and the gaps are where the follow-up starts.

How do we check it against our own records?

Lay the change layer over your latest aerial photograph or a district you have already surveyed. Tell us where your ground truth is when the area is scoped, and it can be compared in the first edition.

Why medium resolution?

Expansion against a growth boundary is a zone-scale question. Medium resolution suits a question asked once a year across a whole region.

What happens where clouds cover part of the area?

The composite takes the best cloud-free pixels available. Zones that stay cloudy may need a longer window, and the delivery says where.

Can it show informal settlement detail?

Not at this resolution. Small informal building may not resolve, so treat the layer as zone-level evidence.

Can we run it more than once a year?

Not on this offer. Annual is the cadence.

Who owns the layers and the imagery rights?

Use and ownership terms for the delivered layers are written into the contract before work starts. The public satellite archives keep their own licences.

How is it priced?

Each region is scoped and quoted on its own, from the size of the area and the number of editions you want. You get a written scope you can take through procurement.

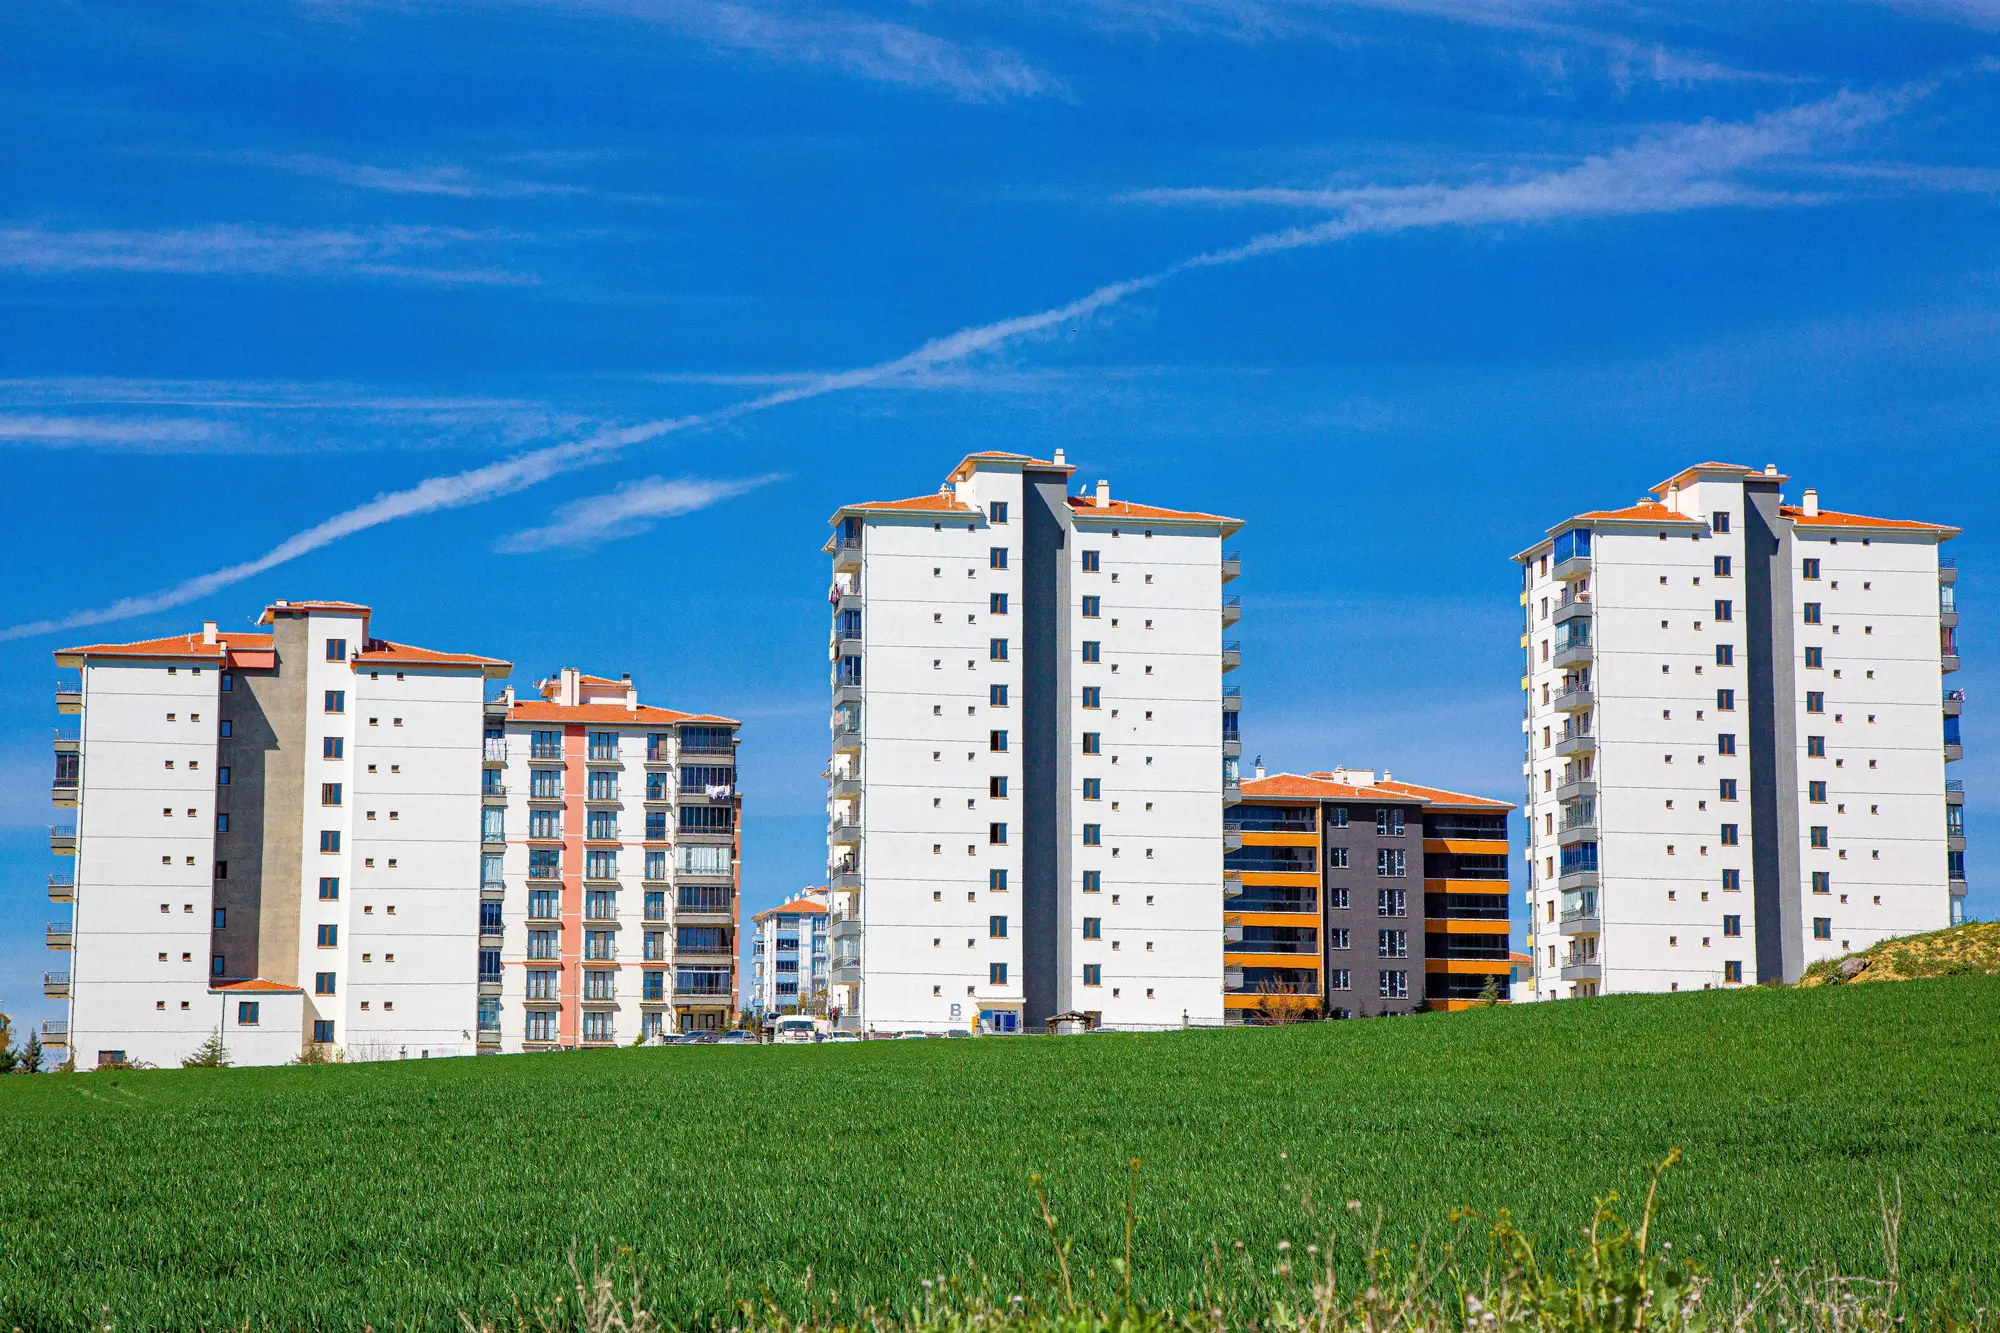
New apartment towers standing at the edge of a green field under a blue sky

Put a number on this year's growth.

Send us the region and the growth boundary, or ask in the chat.

Get started