Medium- vs high-resolution imagery for growth boundary monitoring
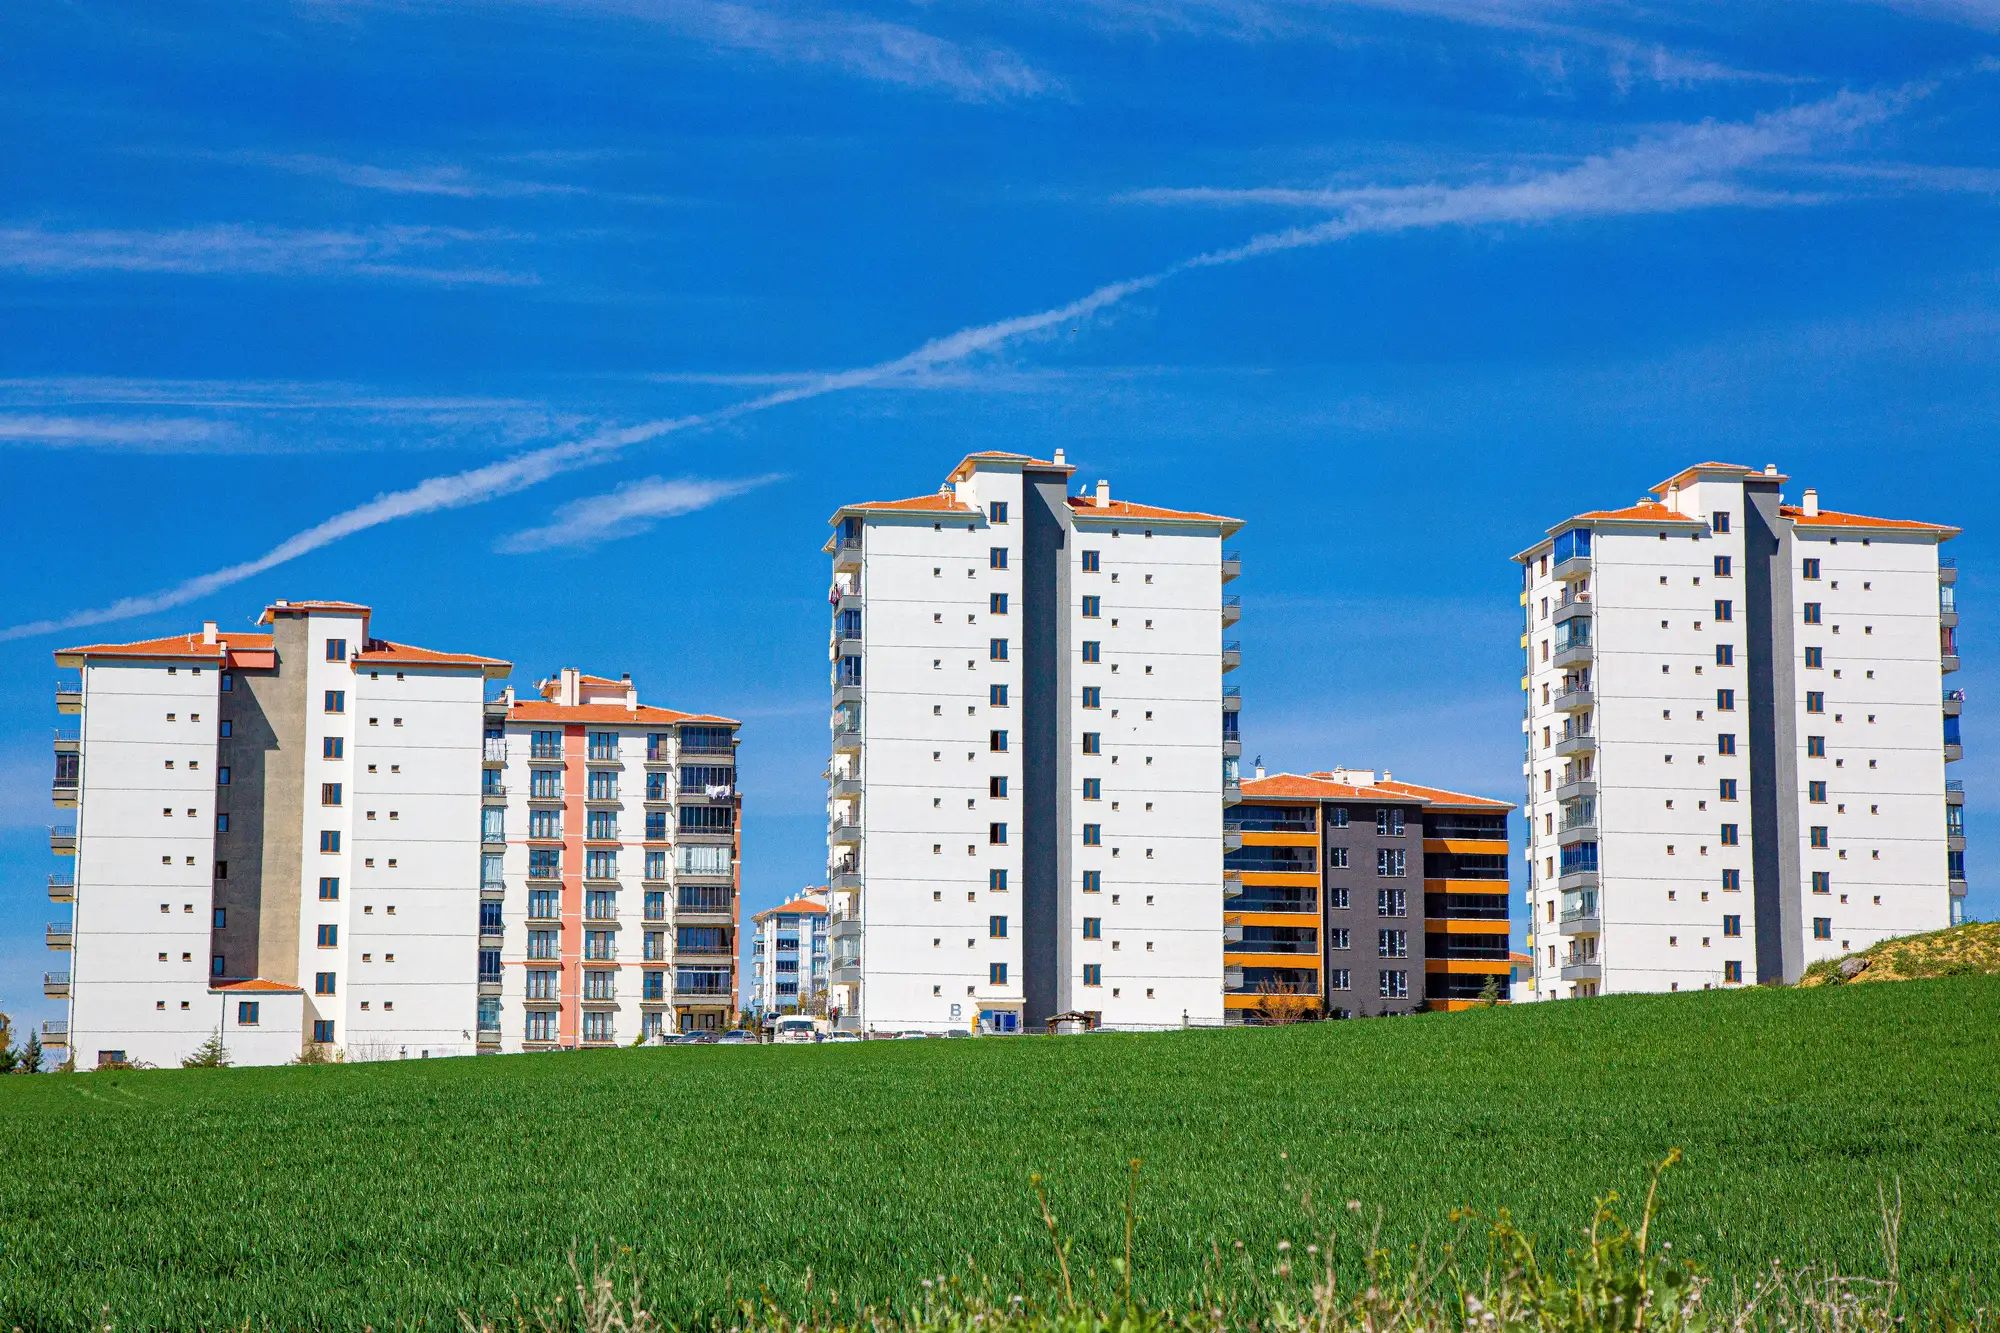
Every planning department that's tried to answer "did the city grow outside the line this year" runs into the same fork: pull high-resolution imagery and get gorgeous rooftop-level detail, or pull medium-resolution imagery and get something coarser, cheaper, and available on the same schedule every year. The choice matters more than it looks, because it decides whether the monitoring program survives past its first budget cycle.
What "resolution" actually buys you
Ground sample distance, GSD, is the size of one pixel on the ground. Sub-meter imagery, commonly 30-50 cm, resolves individual buildings, driveways, even rooftop materials. That's the right tool for a site inspection, a permit dispute over one parcel, or verifying a single structure after a complaint comes in.
Medium-resolution imagery, in the 3-10 m range, resolves something different: the footprint of built-up land as a pattern. A new subdivision, a strip of warehouses along a bypass road, an informal settlement spreading past the ring road. You lose the ability to count individual rooftops. You gain a pixel size cheap enough, and consistent enough, to run over the same boundary every year without a fresh procurement each time.
For growth boundary monitoring specifically, that trade favors medium resolution almost every time. The question is where the built-up edge moved since last year's baseline, across the whole administrative boundary, at a pixel size that holds steady year after year.
Why annual cadence changes the calculus
High-resolution tasking is built around a specific area and a specific date. That works for a one-off audit. It gets expensive and operationally heavy when a department wants the same answer every year, for the full extent of a municipality or metro region, indefinitely. Medium-resolution satellite archives are built for exactly that: wide swaths, frequent repeat passes, and a price point that survives a recurring line item in next year's budget.
There's also a noise issue that cuts against the usual assumption. Sub-meter imagery can pick up individual vehicles, construction equipment, and partial structures that don't belong in a clean built-up versus not-built-up read at metro scale. Medium resolution smooths past that clutter and tends to produce a steadier year-over-year signal for the one number a growth boundary program needs: hectares of new built-up area, and where they land relative to the line.
What the medium-resolution layer won't tell you
A department running 3-10 m imagery for annual monitoring won't be able to say which of three adjacent parcels triggered an expansion, or settle a dispute over one building's footprint from the satellite layer alone. That's still a job for a site visit, a permit file, or a targeted high-resolution pull on the parcel in question.
Most planning ministries that have run both approaches for a few years settle into the same split: coarse-but-annual for the citywide picture, fine-but-occasional for the parcel-level follow-up. The annual layer flags where the edge moved and hands the enforcement team a starting point instead of a blank map. It doesn't replace the person who drives out to look.
A 3-10 m annual layer can tell a planning department whether the built-up footprint crossed the approved boundary anywhere in the metro area this year, and roughly how many hectares were involved. It can't settle whether one particular structure went up without a permit. That still takes a site visit or a targeted high-resolution pull on the parcel in question.
Urban Growth Monitor builds that first answer: an annual built-up change map set against your approved growth boundary, with the hectares of out-of-plan expansion counted for you.
See where your city crossed the line this year.