Setting a buffer around a growth boundary without flagging noise
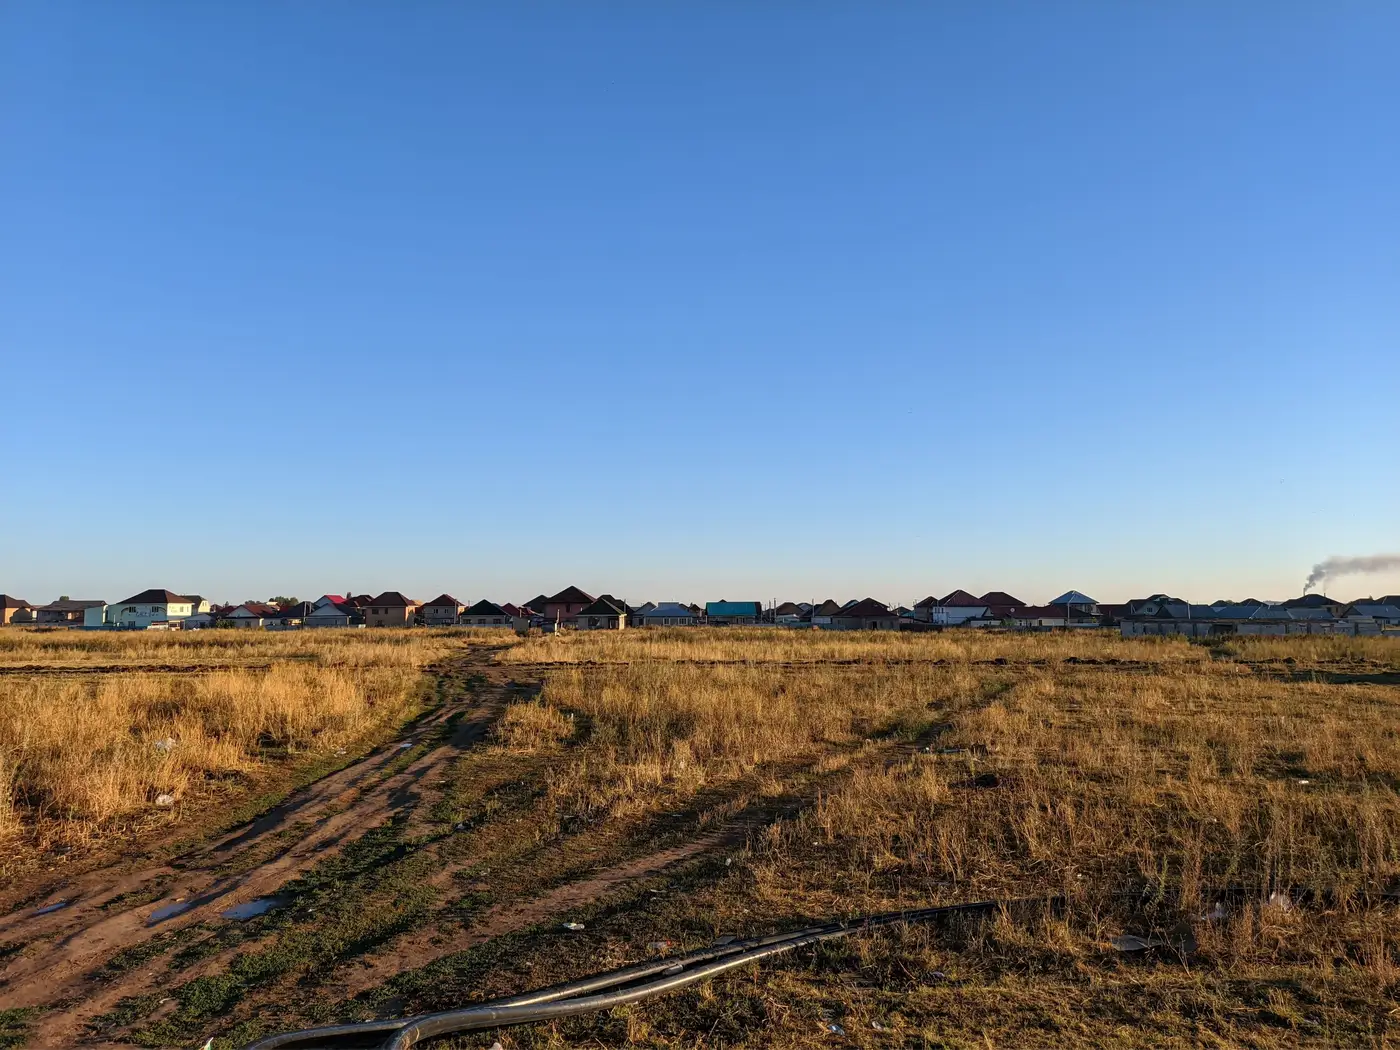
A growth boundary on a planning map looks like a clean line. In practice it's a vector traced from a shapefile, often inherited from a master plan drafted years before anyone thought about how it would be checked against satellite imagery. The question every analyst eventually hits: how wide should the buffer be before a built-up pixel outside the line counts as encroachment, and how wide before it's just noise from how the data was captured.
Why the line itself isn't the problem
The boundary is drawn to legal precision, often to the parcel or to a specific coordinate pair. Medium-resolution satellite imagery, the 3 to 10 meter ground sample distance most annual monitoring runs on, isn't drawn to that precision. A single pixel at 10m GSD can straddle the boundary and the parcel next to it. Georeferencing error, seasonal shadow, and the age of the base map the boundary was digitized from all add a few meters of uncertainty before anyone has looked at a single new building.
Set the buffer at zero and you'll flag structures that sat comfortably inside the boundary the whole time, just on the wrong side of a pixel. Set it too wide and a subdivision that's genuinely outside the line gets absorbed into "within tolerance" for a year or two before anyone notices.
Matching buffer width to your imagery's resolution
A working rule analysts use: the buffer should cover at least one to two pixels of whatever resolution you're monitoring at. At 10m GSD that's a 10 to 20 meter buffer as a starting point, tightened or loosened depending on how clean the original boundary digitization was and how flat or built-up the terrain is at the edge. A boundary that follows a river or ridge line usually needs less buffer than one that cuts across flat agricultural land with no visible feature to anchor it.
Don't confuse this with a legal setback buffer, the kind a zoning code sets for road frontage or property lines. That's a planning rule, not a measurement tolerance. The monitoring buffer exists to separate real construction outside the line from pixels that merely look like they are. Running both buffers in the same layer muddies both, and whoever reviews the flags later won't know which rule produced which number.
Flagging by hectares, not by pixel count
A single flagged pixel outside the buffer is rarely worth a report. A cluster of flagged pixels covering half a hectare, sitting in roughly the same place two years running, usually is. Most monitoring teams end up setting a minimum area threshold, something like 0.25 or 0.5 hectares of contiguous built-up change beyond the buffer, before a flag gets written up as encroachment rather than logged as a watch item. That threshold does more to cut false alarms than tightening the buffer ever will, because it filters for persistence and size instead of raw distance.
The cheapest way to pick both numbers is to test them against a year you already know the answer for. Take a boundary and a year where permit records or a site visit already confirmed which parcels outside the line were actually built and which were imagery artifacts. Run two or three candidate buffer widths against that year and see which one separates the confirmed cases from the false ones most cleanly. If 15 meters catches every confirmed violation and none of the false ones, you don't need to argue about it further. If every candidate width still mixes the two, the problem usually isn't the buffer. It's the base digitization of the boundary itself.
Write the chosen width and hectare threshold down somewhere other than one analyst's head. Growth boundaries get revised and imagery providers change resolution over time, so whoever inherits this layer next needs a record of why the number is what it is. Knowing that it currently works isn't something the next person can inherit; the reasoning behind it is.
Urban Growth Monitor runs this comparison every year as a single built-up change map, lined up against the approved boundary with a hectare figure attached to whatever expansion falls outside it. If you're tired of rebuilding this buffer logic by hand each cycle, see how the yearly comparison works and whether it fits the boundary you're tracking.