How to report out-of-boundary urban growth to a development bank
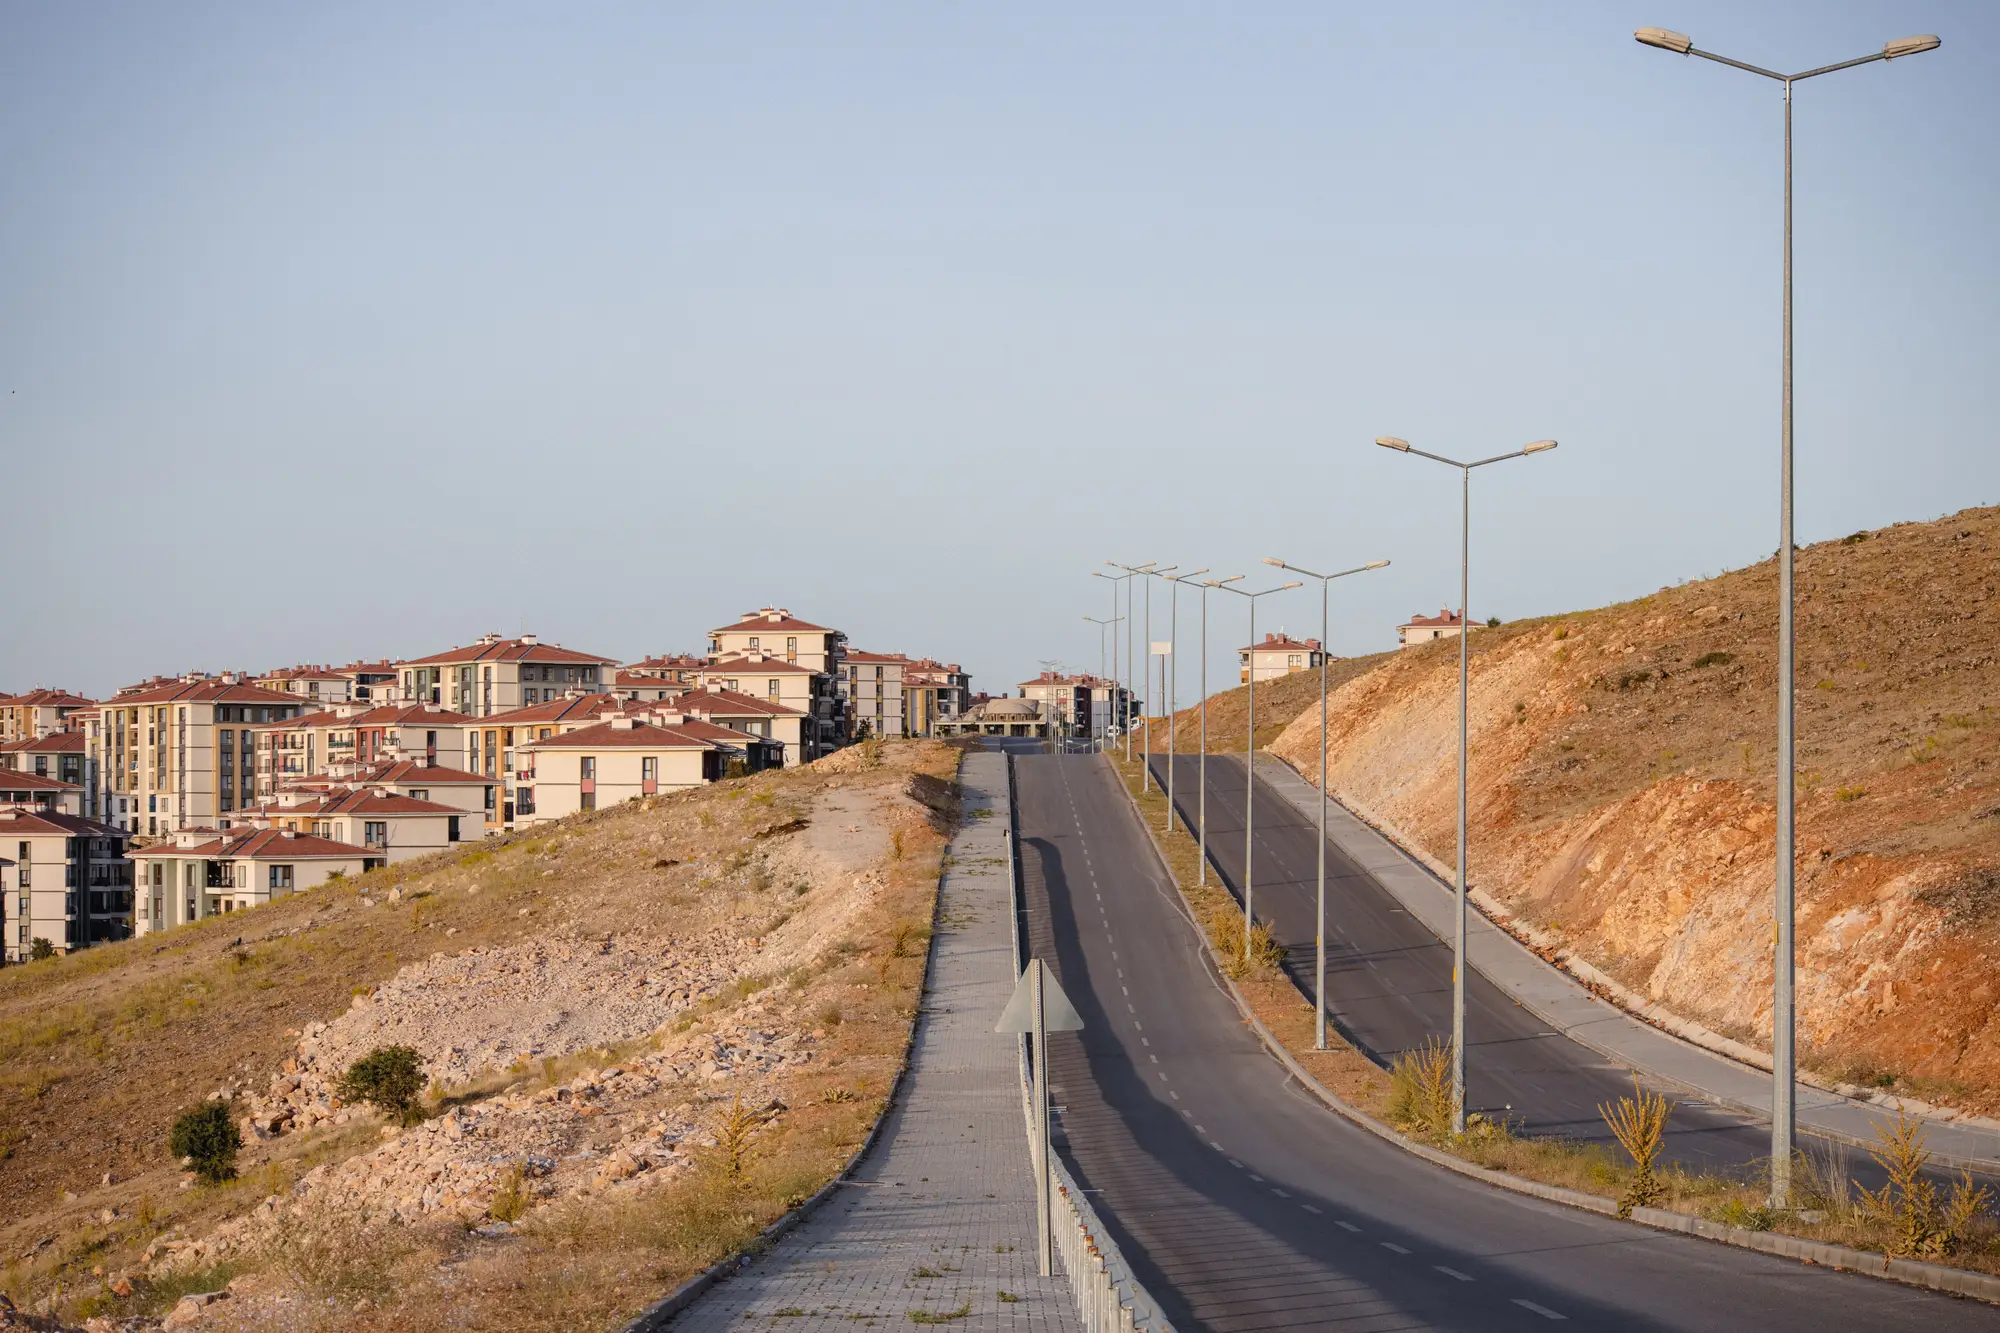
If your ministry took out a World Bank or ADB urban development loan with a growth boundary clause attached, you already know the annual review isn't optional. Somewhere in the loan agreement is a line committing the borrower to keep built-up expansion inside an approved boundary, and somewhere on your desk is a stack of old aerial photos and building permit ledgers you're supposed to turn into a compliance statement. Most analysts do this by hand once a year, and most analysts hate it.
A development bank's monitoring team wants a number: how many hectares of new construction landed outside the line this year, where, and whether that figure is trending up or down against the last reporting cycle. Here's how to build that number without redoing a manual overlay every twelve months.
What the bank's monitoring team actually reads
Covenant monitoring reports get reviewed fast, often by a portfolio officer juggling a dozen other loans. They're looking for three things: a built-up footprint for the current year, the boundary polygon from the loan's environmental and social framework, and the overlap between them expressed as hectares. If your report buries that in paragraphs of context before the number shows up, it gets re-read twice and flagged for clarification, which costs you another round-trip.
The cleanest version of this report is a single annual built-up change map paired with one figure: hectares of unplanned expansion, broken down by district or growth cell if your boundary has sub-zones. Banks also want to see the prior year's figure next to it, because a covenant isn't assessed in isolation. A ministry reporting 40 hectares of boundary breach after reporting 25 the year before is a different conversation than one holding steady at 25.
Getting from aerial photos to a hectare figure
The slow way is what most teams still do: pull the latest aerial or satellite pass, trace built-up extent by eye in a GIS layer, overlay it on the boundary shapefile, and measure the sliver that falls outside. It works, but it takes a planner days per cycle, and the output depends on who did the tracing. Swap the reviewer and the number moves.
The faster path is to run that comparison against medium-resolution satellite imagery, 3 to 10 meter ground sample distance, checked on the same annual cadence as your reporting calendar. You get a built-up footprint for the year, lined up against your boundary file, with the breach area already measured in hectares rather than eyeballed off a screen. That's the layer Urban Growth Monitor produces: one annual read of where the city's footprint moved past the approved line, and the plain hectare figure that goes straight into your covenant filing.
A few things worth confirming before you lean on any imagery-based figure for a loan covenant:
- Match the boundary file's coordinate system and vintage to the imagery year. A boundary redrawn mid-cycle will throw off your overlap math if you're comparing against stale footprint data.
- Decide how your report treats construction that's permitted but not yet built. A covenant typically cares about built footprint, not approved plans, so keep those two things separate in the narrative even if the bank asks about both.
- Keep last year's figure in the same document. Banks read trend, not a snapshot.
Writing it into the covenant narrative
Once you have the map and the number, the report itself is short. State the boundary reference (loan agreement annex, zoning order number, whatever your framework cites), the reporting period, the hectare figure for unplanned expansion, and the year-over-year delta. Attach the change map as a visual exhibit rather than the centerpiece. Loan officers want the figure in the text; the map is there to back it up if someone on the bank's side wants to see where, specifically, the breach happened.
If your ministry has been assembling this comparison by hand each cycle, it's worth seeing what an annual read against your own boundary file looks like before the next reporting deadline comes around. Urban Growth Monitor builds that comparison once a year so the covenant number is ready rather than reconstructed from scratch.
Get your boundary file and last year's report in front of it, and see the number before your next filing is due.